NGINX App Protect Dos (NAP Dos)
NAP Dos について
NAP Dosは、ワールドワイドで実績豊富なF5製WAFのL7DoS機能を移植した、NGINX Plusの動的モジュールで実現するWAFです。
NAP DosはNGINXの動的モジュールであるという特徴から、GatewayからIngress Controller、更にコンテナとして柔軟なデプロイが可能です。


1. NAP Dos の設定
1. 設定
NAP Dosを設定します
# sudo su
cd /etc/nginx/conf.d
cp ~/f5j-nginx-plus-lab2-security-conf/l7dos/l7dos-l1_demo.conf /etc/nginx/conf.d/default.conf
cp ~/f5j-nginx-plus-lab2-security-conf/l7dos/l7dos-l1_plus_api.conf /etc/nginx/conf.d/plus_api.conf

mkdir -p /etc/nginx/conf.d/ssl
cp ~/f5j-nginx-plus-lab2-security-conf/ssl/* /etc/nginx/conf.d/ssl/

# nginx.conf の copy
cp /etc/nginx/nginx.conf /etc/nginx/nginx.conf-
cp ~/f5j-nginx-plus-lab2-security-conf/l7dos/l7dos-l1_nginx.conf /etc/nginx/nginx.conf
設定ファイルを確認します。なお、NGINXのバージョンが異なると以下の結果も異なる場合がございます。
diff -u /etc/nginx/nginx.conf- /etc/nginx/nginx.conf
 1--- nginx.conf- 2023-01-24 19:34:56.530164984 +0900
 2+++ nginx.conf  2023-01-24 19:37:00.063823686 +0900
 3@@ -8,16 +8,18 @@
 4
 5 user  nginx;
 6 worker_processes  auto;
 7+worker_rlimit_nofile 10240;
 8
 9 error_log  /var/log/nginx/error.log notice;
10 pid        /var/run/nginx.pid;
11
12
13 events {
14-    worker_connections  1024;
15+    worker_connections 10240;
16+    accept_mutex       off;
17+    multi_accept       off;
18 }
19
20-
21 http {
22     include       /etc/nginx/mime.types;
23     default_type  application/octet-stream;
24@@ -31,28 +33,11 @@
25     sendfile        on;
26     #tcp_nopush     on;
27
28-    keepalive_timeout  65;
29+    keepalive_timeout  300s;
30+    keepalive_requests 1000000;
31
32     #gzip  on;
33
34     include /etc/nginx/conf.d/*.conf;
35 }
36
37-
38-# TCP/UDP proxy and load balancing block
39-#
40-#stream {
41-    # Example configuration for TCP load balancing
42-
43-    #upstream stream_backend {
44-    #    zone tcp_servers 64k;
45-    #    server backend1.example.com:12345;
46-    #    server backend2.example.com:12345;
47-    #}
48-
49-    #server {
50-    #    listen 12345;
51-    #    status_zone tcp_server;
52-    #    proxy_pass stream_backend;
53-    #}
54-#}
55-# NGINX Plus Usage Reporting
56-#
57-# By default, every 30 minutes, NGINX Plus will send usage information
58-# to NGINX Instance Manager, resolved by a "nginx-mgmt.local" DNS entry.
59-# Alternate settings can be configured by uncommenting the "mgmt" block
60-# and optional directives.
61-#
62-#mgmt {
63-    #usage_report endpoint=nginx-mgmt.local interval=30m;
64-    #resolver DNS_IP;
65-
66-    #uuid_file /var/lib/nginx/nginx.id;
67-
68-    #ssl_protocols TLSv1.2 TLSv1.3;
69-    #ssl_ciphers DEFAULT;
70-
71-    #ssl_certificate          client.pem;
72-    #ssl_certificate_key      client.key;
73-
74-    #ssl_trusted_certificate  trusted_ca_cert.crt;
75-    #ssl_verify               on;
76-    #ssl_verify_depth         2;
77-#}
NAP DoSの設定を含むコンフィグファイルを確認します。server block にて各種 L7Dos の設定を読み込んでいます。
cat /etc/nginx/conf.d/default.conf
 1upstream server_group {
 2    zone backend 64k;
 3    server security-backend1:80;
 4}
 5
 6log_format log_dos ', vs_name_al=$app_protect_dos_vs_name, ip=$remote_addr, tls_fp=$app_protect_dos_tls_fp, outcome=$app_protect_dos_outcome, reason=$app_protect_dos_outcome_reason, ip_tls=$remote_addr:$app_protect_dos_tls_fp, ';
 7
 8# dos
 9server {
10    listen 8080;
11    keepalive_requests 100000;
12    server_name juiceshop;
13    ssl_certificate_key conf.d/ssl/nginx-ecc-p256.key;
14    ssl_certificate conf.d/ssl/nginx-ecc-p256.pem;
15    ssl_session_cache shared:SSL:10m;
16    ssl_session_timeout 5m;
17    ssl_ciphers AES128-GCM-SHA256;
18    ssl_protocols SSLv3 TLSv1 TLSv1.1 TLSv1.2 TLSv1.3;
19    app_protect_dos_security_log_enable on;
20    app_protect_dos_security_log "/etc/app_protect_dos/log-default.json" syslog:server=elasticsearch:5261;
21    access_log syslog:server=elasticsearch:5561 log_dos;
22
23    location / {
24        app_protect_dos_enable on;
25        app_protect_dos_name "juiceshop";
26        app_protect_dos_monitor uri=http://security-backend1:80/ timeout=3;
27        app_protect_dos_policy_file "/etc/app_protect_dos/BADOSDefaultPolicy.json";
28        proxy_pass http://server_group;
29    }
30}
cat /etc/app_protect_dos/log-default.json
1{
2  "filter": {
3    "traffic-mitigation-stats": "all",
4    "bad-actors": "top 10",
5    "attack-signatures": "top 10"
6  }
7}
cat /etc/app_protect_dos/BADOSDefaultPolicy.json
1{
2    "mitigation_mode" : "standard",
3    "signatures" : "on",
4    "bad_actors" : "on",
5    "automation_tools_detection" : "on",
6    "tls_fingerprint" : "on"
7}
cat /etc/nginx/conf.d/plus_api.conf
 1server {
 2    listen 8888;
 3    access_log /var/log/nginx/mng_access.log;
 4
 5    location /api {
 6        app_protect_dos_api;
 7    }
 8
 9    location = / {
10        rewrite ^(.*)$ https://$host/dashboard-dos.html permanent;
11    }
12
13    location = /dashboard-dos.html {
14        root   /usr/share/nginx/html;
15    }
16
17}
プロセスを再起動し、設定を反映します
nginx -s reload
2. 事前準備
1. 疎通確認
まず初めにサンプルアプリケーションにアクセスできることを確認します。
OWASP Juice Shop というアプリケーションが動作しています。curl -s localhost:8080 | grep title
1<title>OWASP Juice Shop</title>
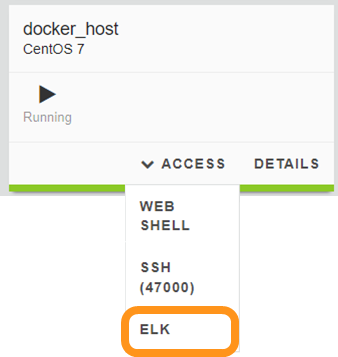
2. ELKの確認
この通信の結果をELKで取得していることを確認します
Jump Host でブラウザを起動し、 http://elk:5601 を開いてください
Note
クライアント端末のブラウザより、以下の手順で接続いただくことも可能です
左上メニューを開いてください。
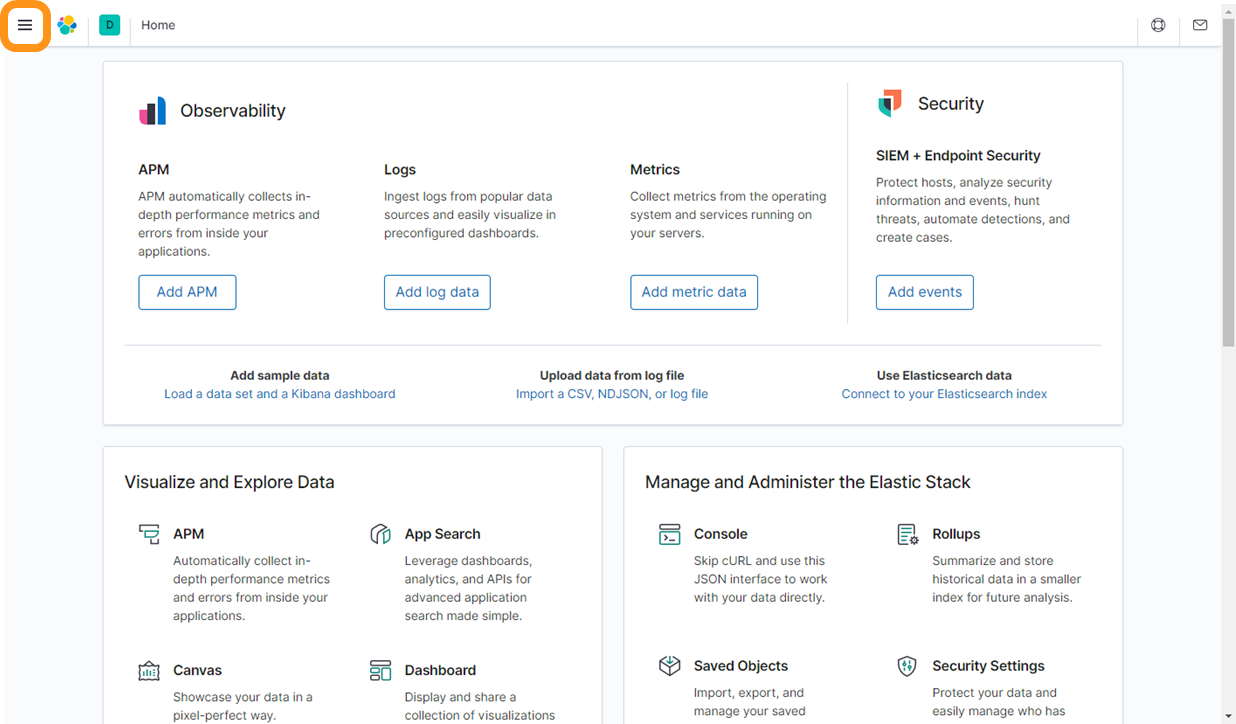
Discover をクリックし、表示された画面の + Add filter の下にすでに登録されている app-protect-dos-logs を選択してください

Refresh をクリックしてください。
左上テキストボックスに vs_name_al と入力し、Enter を押してください。以下のように該当のログが出力されることが確認できます

3. NGINX Plus Dashboard の確認
NGINX Plus Dashboardで今後ステータスを確認するため、ブラウザでアクセスしておきます
作業を行うホストからブラウザでNGINX Plus Dashboardを開く場合、 ubuntu01 の接続はメニューより PLUS DASHBOARD をクリックしてください。
踏み台ホストから接続する場合、ブラウザで http://10.1.1.7:8888/dashboard-dos.html を開いてください
表示されたオブジェクトをクリックしてください


Nameが保護対象となるapp_protect_dos_nameで指定したオブジェクト名が表示されますHealthからLearningが現在の状態を示しますProtocolからTLS Fingerprintは設定で指定した内容を示します
4. 作業ホストへ接続
正常な通信は docker_host(10.1.1.5) より、攻撃トラフィックは ubuntu02(10.1.1.6) より実行します
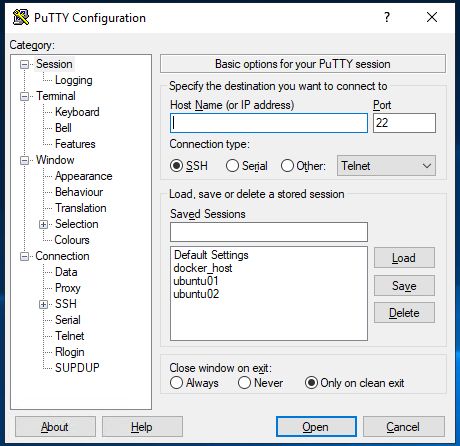
Windows Jump Hostへログインいただくと、SSHClientのショートカットがありますので、そちらをダブルクリックし
docker_host へ接続ください
双方のホストで必要なファイルを取得します
sudo su -
git clone https://github.com/BeF5/f5j-nginx-plus-lab2-security-conf.git
スクリプトに実行権限を付与します
cd ~/f5j-nginx-plus-lab2-security-conf/l7dos/
chmod +x *sh
2. Slow HTTPの実施
1. ベーストラフィックの実行
以下の作業は、 docker_host(10.1.1.5) にて実行します
10分 程度経過した後次のタスクを実施してください。./good.sh
# NAP DoSのラボが完了後、Ctrl+C で停止していただきます
1JUICESHOP HTTP Code:200
2
3JUICESHOP HTTP Code:200
4...
2. Dashboardの表示
1. NGINX Plus Dashboardの表示
Dashboardを開くと、トラフィックが転送されている状態が確認できます

一定時間トラフィックを正しく転送し学習が完了した場合、 Learning が Ready となります
Note
NGINX Plus Dashboard の NAP DoS の Graph 表示は崩れることが多いので参考程度に参照してください
2. ELK ステータスの確認
左上メニューを開いてください。
Dashboard をクリックし、 AP_DOS: AppProtectDOS を開きます

Note
Dashboardの左上テキストボックスに、デフォルトの条件が指定されているので削除してすべての情報が表示されるように変更ください

docker_host(10.1.1.5) からのトラフィックを受信し、すべて Allow(許可) となっていることがわかります

グラフの表示項目は以下の内容です
Top talkers: 保護対象サービスに対し接続を行うクライアント、及びその各通信制御状況Client HTTP transactions/s: クライアントのHTTP TransactionHTTP mitigation: Mitigationの状況Server HTTP transactions/s: 転送先サーバのHTTP TransactionServer_stress_level: 転送先サーバのストレスレベルAttack signatures: Attack Signatureが生成されたログDetected bad actors: Bad Actorが検知されたログGeo: Geolocationを用いた送信元情報
Note
実際のラボでは、 AP_DOS: Top talkers に 127.0.0.1 初回に実施した Curl が含まれますがその結果は除外してご確認ください
3. Slow HTTPの実施
以降の作業は、 ubuntu02(10.1.1.6) で実行します。
以下コマンドを実行し Slow HTTP を発生させ、状態を確認します。 3分 を目安に攻撃コマンドを Ctrl+C で停止してください
Note
長時間にわたり攻撃を行った場合、ベースラインのスクリプトも制御対象に含まれ、通信が拒否される場合があります
Docker RUNにてコンテナを起動するため、はじめにコンテナイメージを取得し、その後トラフィックを実行します
sudo docker run --rm shekyan/slowhttptest:latest -c 50000 -B -g -o my_body_stats -l 600 -i 5 -r 1000 -s 8192 -u http://10.1.1.7:8080/rest/products/search?q=vodka -x 10 -p 3
# 本項目の動作を確認後、Ctrl+C で停止してください
1 slowhttptest version 1.8.3
2 - https://github.com/shekyan/slowhttptest -
3test type: SLOW BODY
4number of connections: 50000
5URL: http://10.1.1.7:8080/rest/products/search?q=vodka
6verb: POST
7cookie:
8Content-Length header value: 8192
9follow up data max size: 22
10interval between follow up data: 5 seconds
11connections per seconds: 1000
12probe connection timeout: 3 seconds
13test duration: 600 seconds
14using proxy: no proxy
15
16Tue Jan 24 10:27:04 2023:
17slow HTTP test status on 0th second:
18
19initializing: 0
20pending: 1
21connected: 0
22error: 0
23closed: 0
24service available: YES
25
26一定時間経過後、テストが開始します
1. NGINX Plus Dashboardの表示
Dashboardを開いてください。正しく表示されない場合ブラウザの更新ボタンをクリックしてください。

Slow HTTP攻撃が開始した後、以下の項目が変化しています
Under Attackがyesと表示されるTraffic の
Mitigation/s (Mitigation per sec)に現在の状況が表示されるTraffic の
Mitigationの値が増加するGraphの
Mitigationsが増加し、赤色で表示される
2. ELK ステータスの確認
こちらの表示結果は、攻撃を実行して一定時間立った結果を示しています
NAP DoS で保護対象となっているオブジェクト・グラフが表示されます。

Client HTTP transactions/s、Server HTTP transactions/sの内容を確認すると、予め実行した正常(と想定した通信)によるBaselineと同等のSuccessful tpsとなっていることがわかります。また、攻撃を検知した後、攻撃トラフィックを緩和し適切にサーバに転送していることがわかりますHTTP Mitigationの内容を確認すると、攻撃を検知した後、状況に応じて順次通信の内容に応じて様々な緩和策を実施していることがわかりますAttack signatures、Detected bad actorsのそれぞれに記録されたログが出力されています
Attack signaturesのログが記録されていることがわかります。内容を確認します

signatures 欄に記載されている内容は以下となります。読みやすいように改行しています
1(http.hdrorder hashes-to 24)
2and (http.referer_header_exists eq true)
3and (http.request.method eq POST)
4and (http.user_agent contains other-than(IE|Firefox|Opera|Chrome|Safari|curl|grpc))
5and (http.referer hashes-to 51)
6and (http.accept contains text/javascript)
7and (http.x_forwarded_for_header_exists eq false)
8and (http.connection_header_exists eq true)
9and (http.uri_parameters eq 0)
10and (http.uri_len between 16-31)
11and (http.content_type_header_exists eq true)
12and (http.cookie_header_exists eq false)
13and (http.uri_file hashes-to 31)
14and (http.headers_count eq 7)
15and (http.content_length_header_exists eq true)
16and (http.accept_header_exists eq true)
17and (http.host_header_exists eq true)
18and (http.user_agent_header_exists eq true)
Bad Actorのログが記録されていることがわかります。内容を確認します

Note
docker_host(10.1.1.5) が bad actor として検知されている場合には、 次のラボで docker_host(10.1.1.5) が bad actorとして検知された場合 を参照してください
4. Slow HTTPの停止
攻撃トラフィックが動作中の場合、 ubuntu02(10.1.1.6) のターミナルで
実行したコマンドを Ctrl+C で停止してください
2. HTTP Floodの実施
1. ベース通信の実施
Slow HTTPのベース通信を実行中の場合はこちらのステップを飛ばしてください。
必要に応じて再度ベース通信を、 docker_host(10.1.1.5) にて実行します
Note
docker_host(10.1.1.5) が bad actorとして検知された場合 、 ubuntu01 (10.1.1.7) でNGINXを再起動し、再度ベーストラフィックを学習してください
service nginx restart
# cd ~/f5j-nginx-plus-lab2-security-conf/l7dos/
# chmod +x *sh
./good.sh
# NAP DoSのラボが完了後、Ctrl+C で停止していただきます
1JUICESHOP HTTP Code:200
2
3JUICESHOP HTTP Code:200
4....
2. Dashboardの表示
Slow HTTPの手順と同様に、 NGINX Plus Dashbaord 、 ELK の内容が表示されることを確認してください
3. HTTP Floodの実施
以降の作業は、 ubuntu02(10.1.1.6) で実行します。
以下コマンドを実行し Slow HTTP を発生させ、状態を確認します
# cd ~/f5j-nginx-plus-lab2-security-conf/l7dos/
# chmod +x *sh
./http1flood.sh

# 本項目の動作を確認後、Ctrl+C で停止していただきます
Docker RUNにてコンテナを起動するため、はじめにコンテナイメージを取得します。 その後、攻撃に該当する通信が実行されます
 1Benchmarking 10.1.1.7 (be patient)
 2Completed 200 requests
 3Completed 400 requests
 4Completed 600 requests
 5Completed 800 requests
 6Completed 1000 requests
 7Completed 1200 requests
 8Completed 1400 requests
 9Completed 1600 requests
10Completed 1800 requests
11Completed 2000 requests
12Finished 2000 requests
13
14
15Server Software:        nginx/1.23.2
16Server Hostname:        10.1.1.7
17Server Port:            8080
18
19Document Path:          /rest/products/search?q=vodka
20Document Length:        Variable
21
22Concurrency Level:      100
23Time taken for tests:   4.121 seconds
24Complete requests:      2000
25Failed requests:        0
26Non-2xx responses:      1714
27Total transferred:      877982 bytes
28HTML transferred:       301674 bytes
29Requests per second:    485.27 [#/sec] (mean)
30Time per request:       206.070 [ms] (mean)
31Time per request:       2.061 [ms] (mean, across all concurrent requests)
32Transfer rate:          208.04 [Kbytes/sec] received
33
34Connection Times (ms)
35              min  mean[+/-sd] median   max
36Connect:        0    1   0.9      1       7
37Processing:     0  186 458.1      2    1886
38Waiting:        0  185 458.3      2    1886
39Total:          0  187 458.2      3    1890
4. Dashboardの表示
1. NGINX Plus Dashboardの表示
Dashboardを開いてください。正しく表示されない場合ブラウザの更新ボタンをクリックしてください。

HTTP Flood攻撃が開始した後、Slow HTTPと同様に以下の項目が変化しています
Under Attackがyesと表示されるTraffic の
Mitigation/s (Mitigation per sec)に現在の状況が表示される(サンプルはスクリーンショット取得のタイミングで通信が発生しなかったため 0)Traffic の
Mitigationの値が増加するGraphの
Mitigationsが増加し、赤色で表示される
2. ELK ステータスの確認
NAP DoS で保護対象となっているオブジェクト・グラフが表示されます。

HTTP Flood攻撃が開始した後、以下の項目が変化しています
Client HTTP transactions/s、Server HTTP transactions/sの内容を確認すると、予め実行した正常(と想定した通信)によるBaselineと同等のSuccessful tpsとなっていることがわかります。また、攻撃を検知した後、攻撃トラフィックを緩和し適切にサーバに転送していることがわかりますSlow HTTPと異なりHTTP Flood の場合には、通信の内容がほぼ正常な通信のため瞬間的にサーバサイドへ転送されますがその後緩和されていることがわかります
HTTP Mitigationの内容を確認すると、攻撃を検知した後、状況に応じて順次通信の内容に応じて様々な緩和策を実施していることがわかりますAttack signatures、Detected bad actorsのそれぞれに記録されたログが出力されています
Attack Signatureのログが記録されていることがわかります。内容を確認します
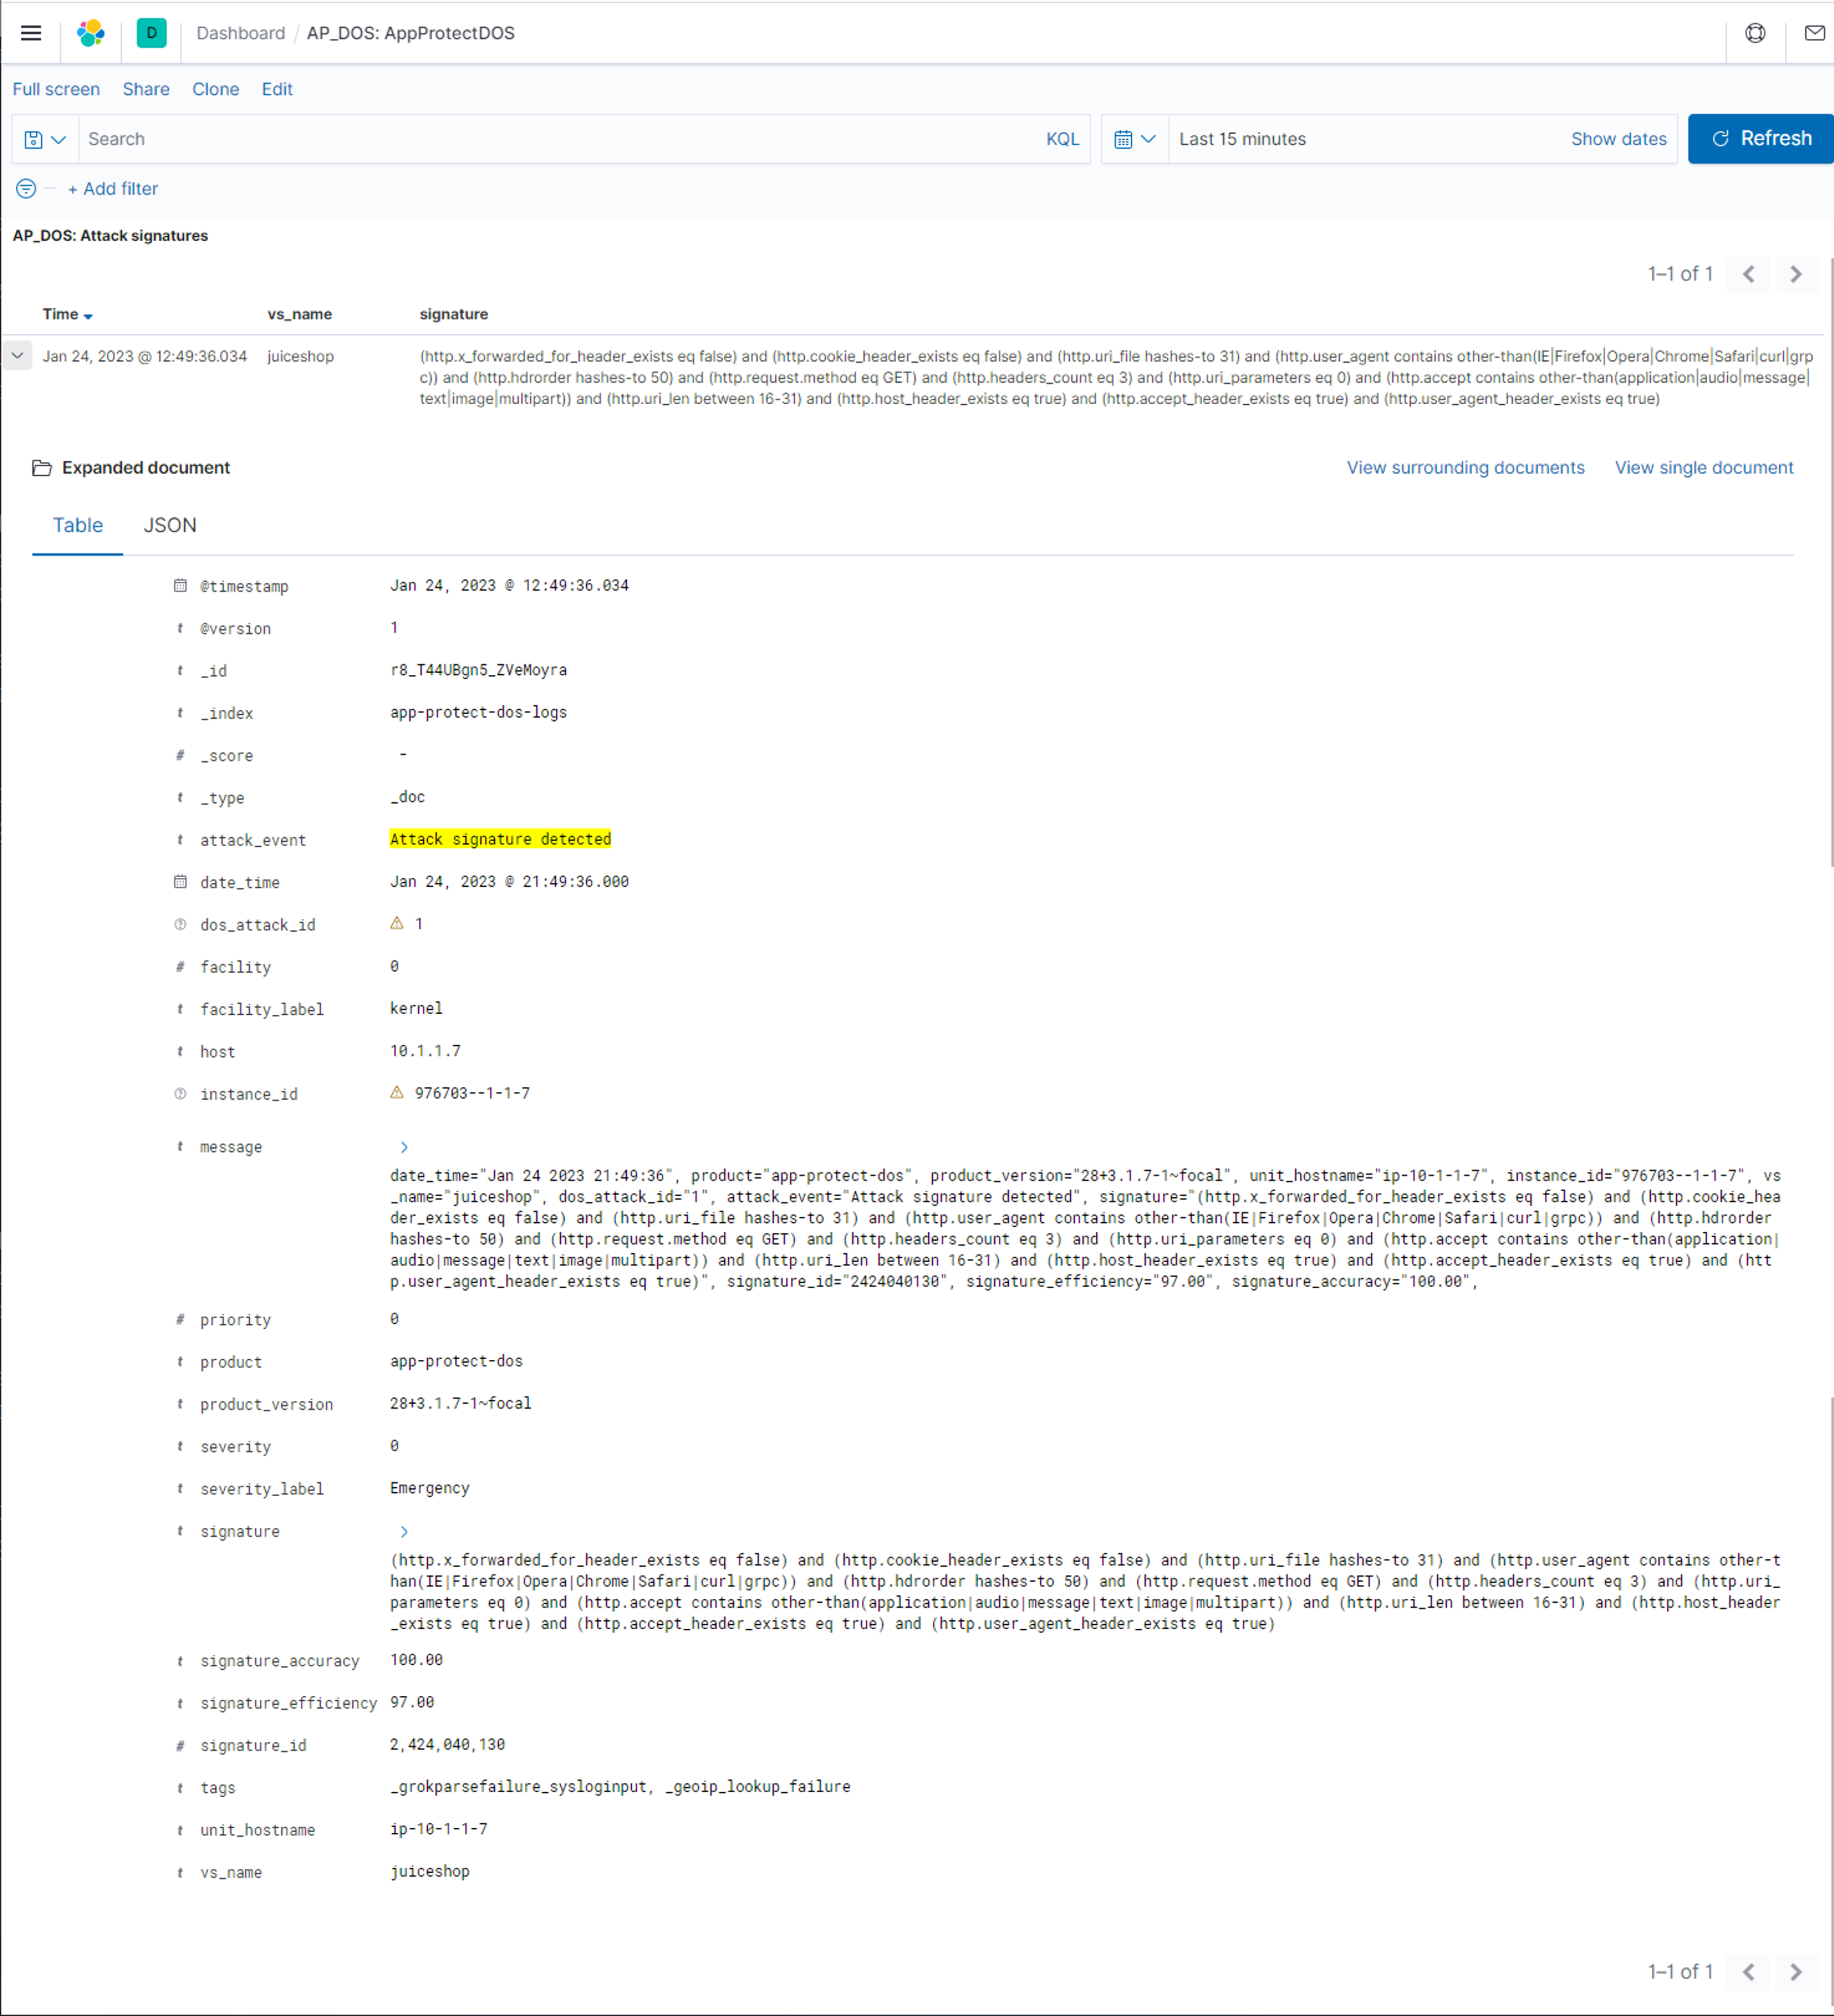
signatures 欄に記載されている内容は以下となります。読みやすいように改行しています
 1(http.x_forwarded_for_header_exists eq false)
 2and (http.cookie_header_exists eq false)
 3and (http.uri_file hashes-to 31)
 4and (http.user_agent contains other-than(IE|Firefox|Opera|Chrome|Safari|curl|grpc))
 5and (http.hdrorder hashes-to 50)
 6and (http.request.method eq GET)
 7and (http.headers_count eq 3)
 8and (http.uri_parameters eq 0)
 9and (http.accept contains other-than(application|audio|message|text|image|multipart))
10and (http.uri_len between 16-31)
11and (http.host_header_exists eq true)
12and (http.accept_header_exists eq true)
13and (http.user_agent_header_exists eq true)
Bad Actorのログが記録されていることがわかります。内容を確認します
